Architecture

© Christian Horn
Monitored Hosts
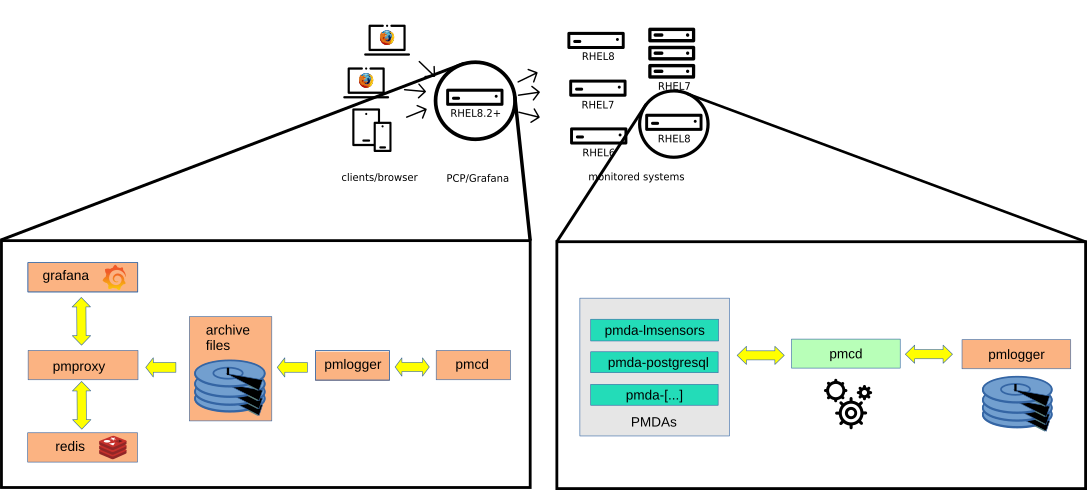
Monitored hosts run the Performance Metrics Collector Daemon (PMCD), which communicates with one or many Performance Metrics Domain Agents (PMDAs) on the same host. Each PMDA is responsible for gathering metrics of one specific domain - e.g., the kernel, services (e.g., PostgreSQL), or other instrumented applications. The pmlogger daemon records metrics from pmcd and stores them in archive files on the hard drive.
Since PCP 5 metrics can also be stored in the redis database, which allows multi-host performance analysis, the pmproxy daemon discovers new archives (created by pmlogger) and stores them in a redis database.
Dashboards
Performance Co-Pilot metrics can be analyzed with Grafana dashboards, using the grafana-pcp plugin. There are two modes available:
historical metrics across multiple hosts using the PCP Redis data source
live, on-host metrics using the PCP Vector data source
The PCP Redis data source sends pmseries queries to pmproxy, which in turn queries the redis database for metrics. The PCP Vector data source connects to pmproxy, which in turn requests live metrics directly from a local or remote PMCD. In this case, metrics are stored temporarily in the browser, and metric values are lost when the browser tab is refreshed. The PCP Redis data source is required for persistence.