Monitoring Containers
Importing the dashboards
grafana-pcp includes the following (optional) dashboards:
PCP Vector: Container Overview (CGroups v1)
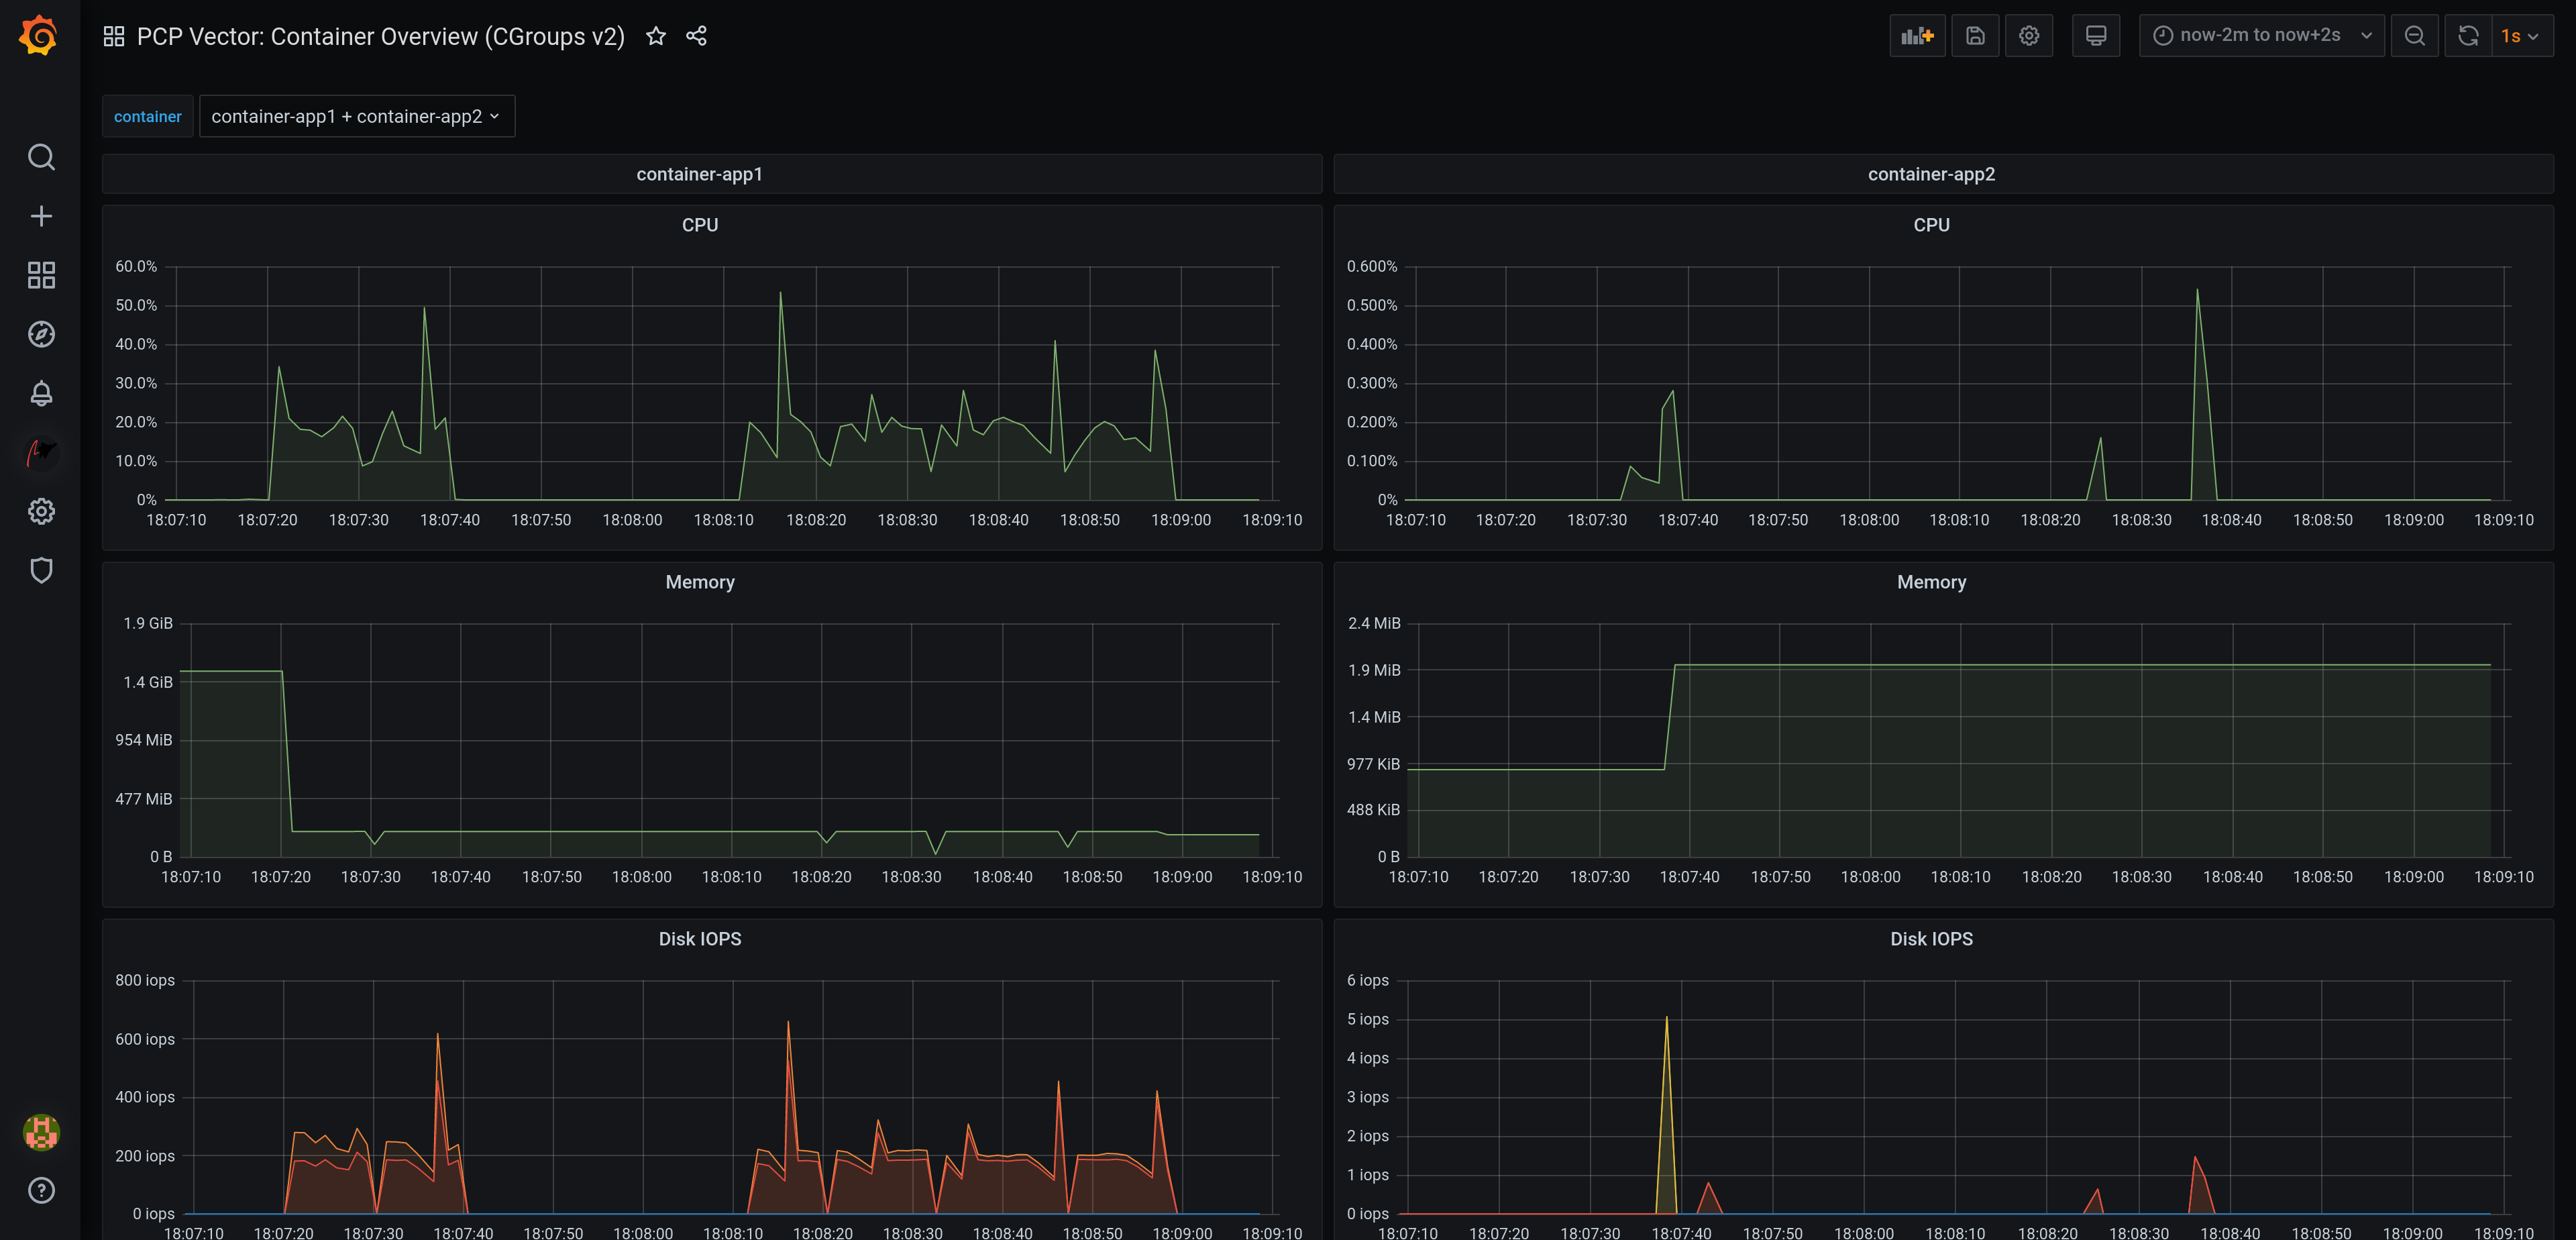
PCP Vector: Container Overview (CGroups v2)
You can import the corresponding dashboard on the PCP Vector data source settings page.
Note
grafana-pcp before version 3.0.0 includes a single dashboard called PCP Vector: Container Overview which supports CGroups v1 only and is installed by default (i.e. no import is required).
Usage
You can choose one or multiple containers in the container drop-down field at the top of the dashboard:
Common Problems
My container doesn’t show up
make sure that the docker and/or podman PMDAs are installed
currently PCP only supports containers started by the root user (there is an open feature request to change this)